Wave II Will Be Long, Local and Late in Ontario
by Paul Minshull, CEO and Founder, Covid-19 Solution Architect
October 2, 2020
As a province we stand at the precipice of an unparalleled risk ahead of us. The major outcome of how Ontario manages the risk of Wave II will be the result of the decisions that are made in response to COVID-19 spread. The best decisions for Ontarians will be informed by proactive forecasting with a longer planning horizon.
Forecasting COVID-19 is incredibly challenging even for epidemiologists and data scientists [i, ii]. We agree. That’s why we want to help. To anticipate potential scenarios, their probabilities, the risks they present to Ontario and what specific mitigation and suppression strategies will alter COVID-19 spread to protect Ontarians, both from a health and economic standpoint.
At a glance:
- Wave II will peak in November or December
- Severity will vary by region
- Population density is a primary driver of severity
- Contact tracing, testing and masks are not enough to constrain the spread
- Movement in communities, open schools and return to work are top forces driving spread
- The move indoors and the seasonal flu will further complicate things
It’s time to stop guessing
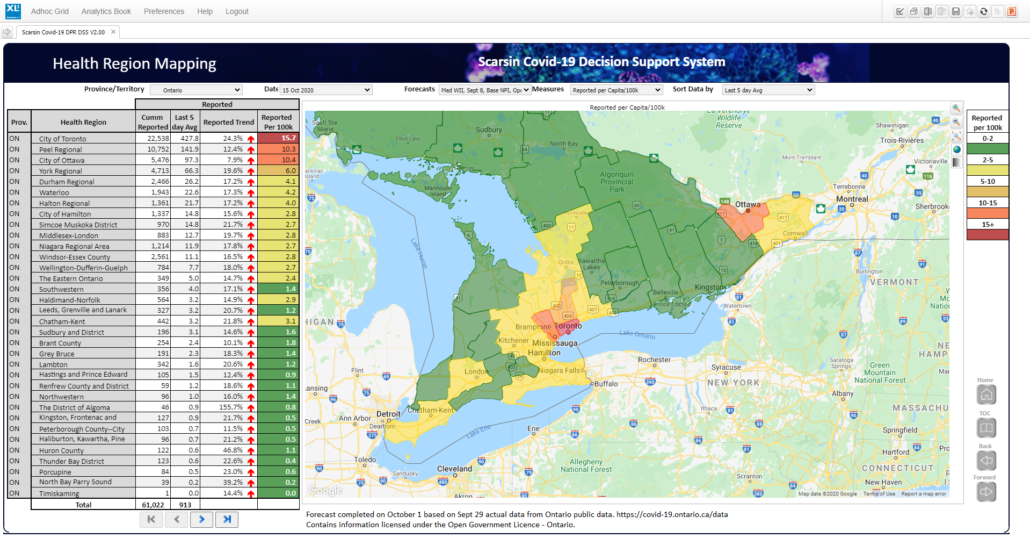
Here is our October 15 forecast for Ontario by Health Region. The colour coding highlights the number of cases per 100,000. The darker areas illustrate that hot spots will continue to drive the provincial growth in cases, with Toronto, Peel and Ottawa leading the way.
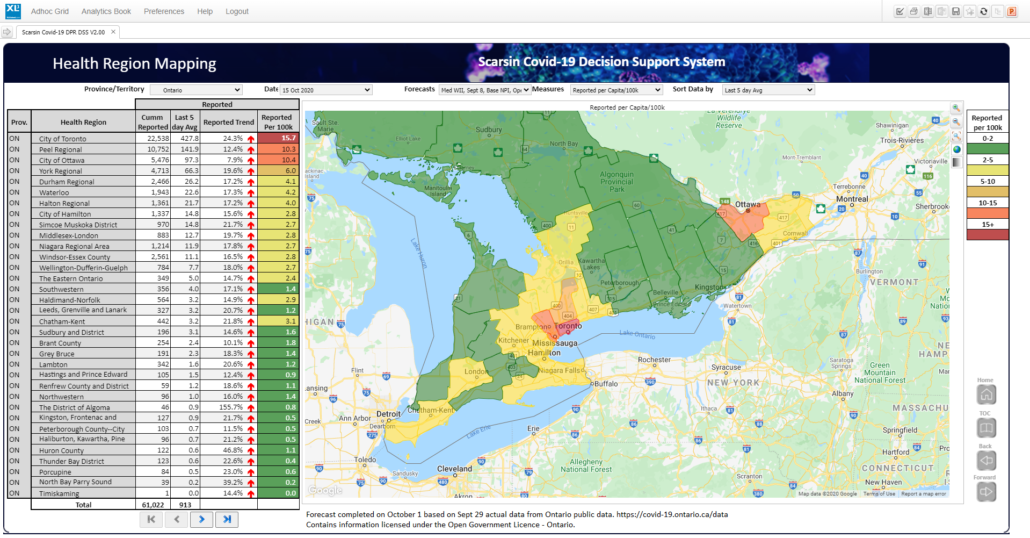
Wave II varies by region, population density
Scarsin has been unwavering and clear in our communication on Wave II [vii]. Figure 2 provides a visual representation of the compelling forces at play for Wave II in Canada. The conclusion is clear. The forces driving the spread of COVID-19 far outweigh the forces restraining it. Which reinforces the point that Wave II was inevitable, but it will manifest itself differently by Health Region based on a number of factors: population density being a major correlated factor.
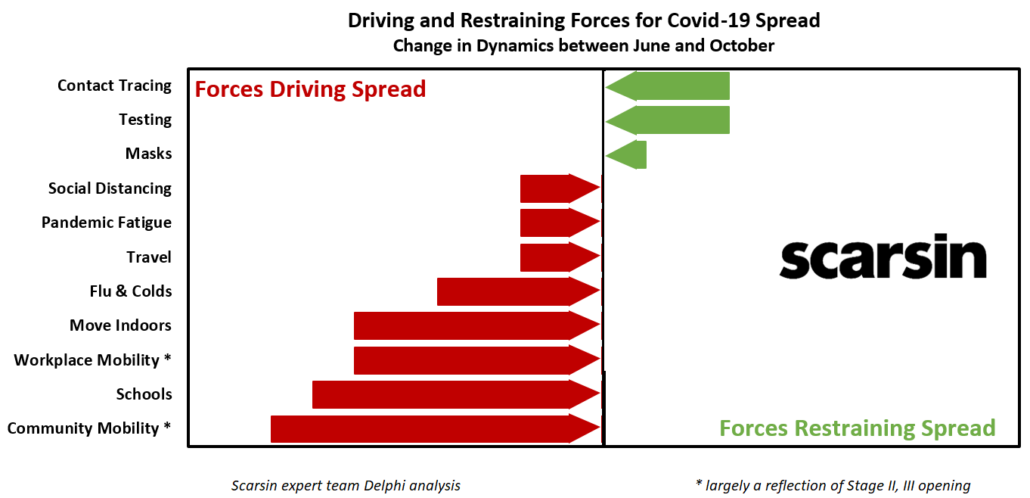
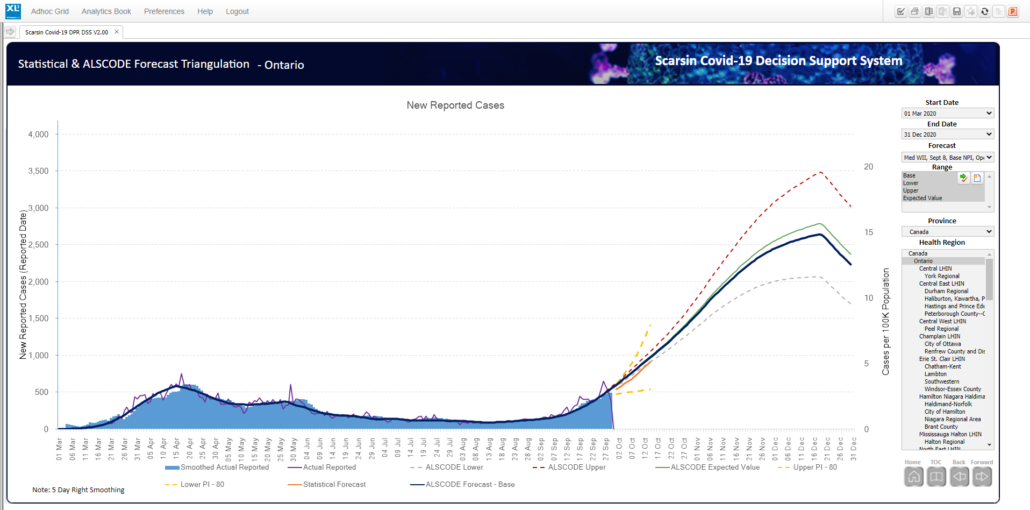
Figure 3 below represents the aggregated Reported Cases for Ontario based on a bottom up forecasting approach for the 34 health regions. This does not incorporate any major immediate enhancements around government interventions. The range of potential peak in December is a low of 2,000, a high of 3,500 with a base of 2,650 and an expected value of 2,750 based on probability analysis.
It is important for Ontario to look at this in perspective. While this is significantly higher than Wave I it is not an unreasonable outcome on a per capita basis. We must also keep in mind that we are just focusing on reported cases in this blog. The Scarsin model has age compartments which allow us to measure the spread across age groups and in turn, the impact to downstream hospitalizations and deaths.
No October Peak
In response to a CBC article on Sept 28, “Ontario’s 2nd wave of Covid-19 forecast to peak in October” none of our forecast scenarios support an October peak [i]. Our COVID-19 decision system forecasts tell us that there is no possibility that Ontario will peak in October based on the current trends and non-pharmaceutical interventions in place effective Oct 1.
The next few weeks of COVID-19 results are already locked in based on incubation, testing and results reporting timeframes. So anything Ontario implements in the next two weeks will impact late October and primarily November driving the peak out further.
Figure 3 above highlights the matter at hand which is now determining how high the peak will be and whether that can be drawn forward into November from December.
In Figure 4 below we have added additional notations (in Green) to the Covid-19 ModCollab forecast provided. The Scarsin forecast had actual data to Sept 29. Based on the actual data and current forecasts for the 34 health regions our forecast is coming in with a lower sloped projection.
But the Scarsin model goes out to May 2021, which highlights a major challenge for Ontario as to (box 1), when will Wave II peak? And, at what level?
Watch for more context in a future blog on the critical differences in Wave I and Wave II behavior and the caution that must be maintained in doing comparison between them.
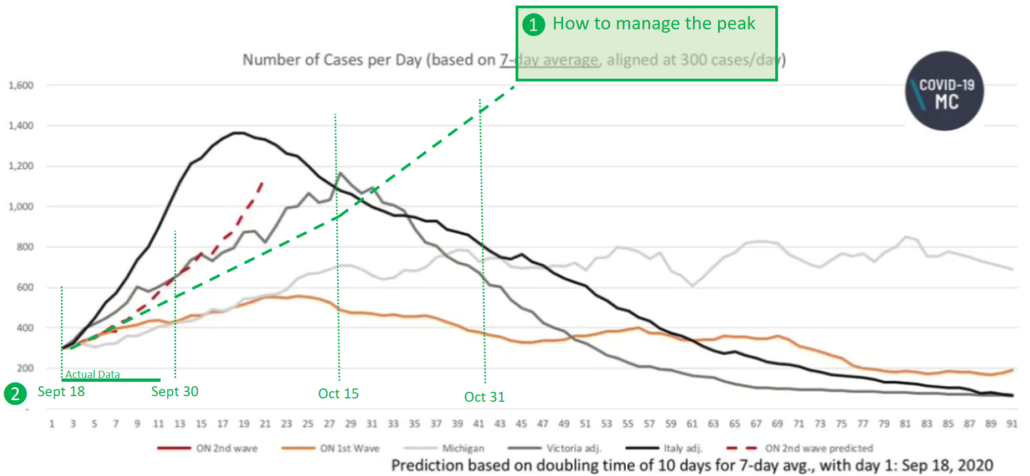
The dotted line shows the current prediction for the start of Ontario’s second wave of COVID-19, based on work by a team of researchers from the University of Toronto, the University Health Network, and Sunnybrook Hospital. The solid lines model how the case numbers will evolve if the second wave follows the patterns seen in Ontario in the spring (orange), in Michigan this summer (light grey), in the Australian State of Victoria (dark grey), or Italy in the pandemic’s first wave (black). (COVID-19 ModCollab)
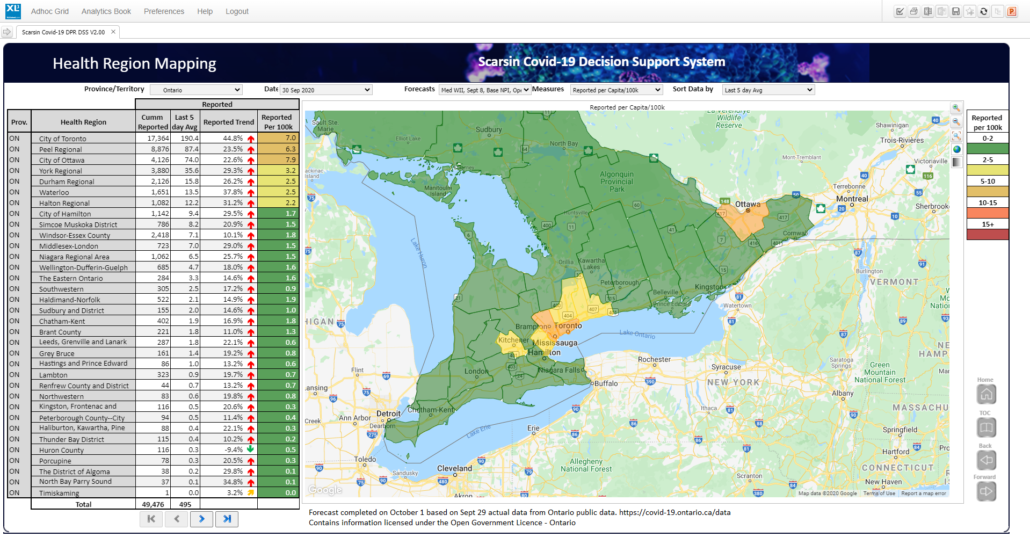
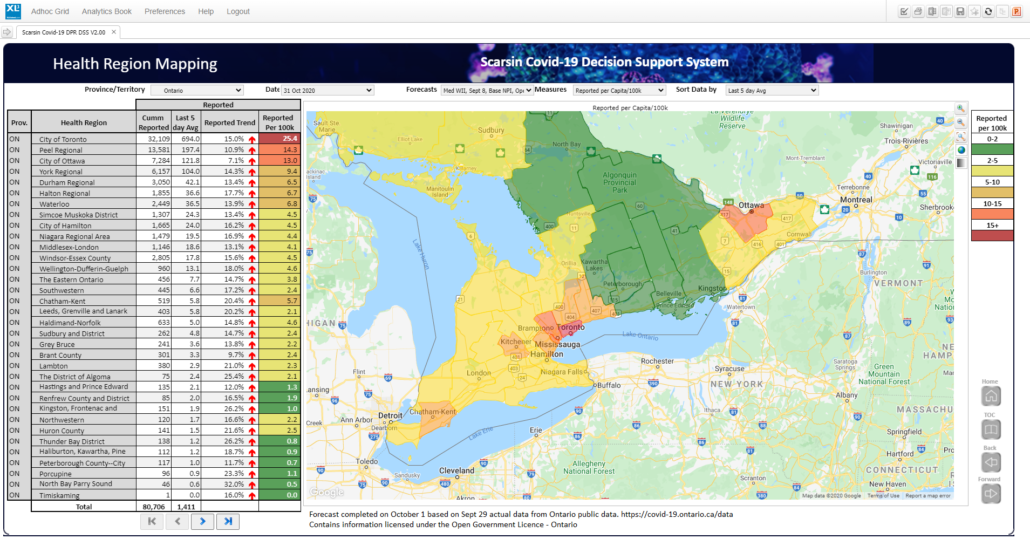
Figures 5, 6, and 7 provide the same baseline forecast spread across the health regions for three time periods. Sept 30, Oct 15 and Oct 30. As mentioned above, this highlights the health region spread. There are likely understatements in our forecasts in the smaller regions as we were reluctant to inject infection where is does not currently exist in a meaningful manner.
By September 30
By October 15
By October 31
The case for bottom up forecasting
In alignment with our expertise and global best practices for COVID-19, accurate forecasting should be done bottom up at the Health Region level to take into account unique dynamics of each health region including demographics, population density, regional policy, etc..
That’s why we self-funded the development of a best practice bottom-up COVID forecasting solution for Canada. Our experts have spent more than 7,500 hours building a national platform for critical decision including:
- Two complementary types of forecasting, capable of modeling real-world conditions for critical decision making across Canada
- Advanced compartmental ODE epidemiological model
- Statistical time series forecasting model
- Calibrated every Health region across Canada using best available information
- Established a macro level understanding of Wave II driver behavior
- Forecasted a baseline spread of COVID-19 based on current interventions for all 92 Health regions in Canada
But we’re not stopping here, we’re already hard at work on future enhancements, including:
- Forecast anticipated escalating interventions based on Health Region hot zones
- What the governments will likely implement
- What the governments should implement
- The variance in impact of decision making
- Forecasting the overlaying impact of vaccine scenarios through mid 2021
We have put the weight of our company’s expertise to help Canada and Ontario. We have created a pragmatic COVID-19 decision support system for this exact moment in time to help set Ontario on a path to recovery.
We have encountered disappointing bureaucratic logjams to improving healthcare decision making using the Scarsin system [iii, iv, v, vi, viii]. Only one Ontario Health Region took the time to listen and we are excited to be collaborating with them! Scarsin is providing transparency into our expertise and the forecasts we’ve generated for Ontario (rest of Canada soon) in the hopes of better informing the public as well as a last call to action for provincial and federal governments to, at minimum, benchmark the Scarsin system vs their current modeling capabilities in this time of need. Scarsin can support decision making for Wave II risk immediately across the country! We are already doing it.
It is disappointing to see the dichotomy between how government, healthcare and private enterprise in Canada have reacted to an advanced forecasting solution. Private enterprise take meetings and quickly recognize the value Scarsin forecasting services can provide to better inform their corporate decision making to the benefit of their employees and customers.
Methodology and Limitations
Scarsin utilizes the positive reported cases based on Reported date. We will explain why we chose this approach in another blog on communicating current trends. We see this as an important topic as Scarsin feels the current communication of daily cases is confusing and in some ways misleading.
The data utilized within this analysis is downloaded directly from the Ontario public downloads. Contains information licensed under the Open Government Licence – Ontario.
This report is not meant to provide direct predictions on the health regions. It is meant to provide potential outcomes and draw insights based on varying specific parameters. It is important to note that the Scarsin solution utilizes an active reforecast process on all scenarios as new daily data is loaded which means that even one week of additional data can change the trajectory of the forecasts either up or down.
References/Endnotes
[i] Sept 28, 2020 – Ontario’s 2nd wave of COVID-19 forecast to peak in October — https://www.cbc.ca/news/canada/toronto/ontario-covid-19-second-wave-cases-modelling-projections-1.5739411
We are at this critical moment right now where we see case numbers increase, and we don’t quite know yet where it’s going
Beate Sander, Scientist at the University Health Network & Canada Research Chair in economics of infectious diseases
[ii] September 9, 2020 – Markham company forecasts failing grade for school reopenings without data modelling, — https://www.yorkregion.com/news-story/10164036-markham-company-forecasts-failing-grade-for-school-reopenings-without-data-modelling/
Often we hear the expression, ‘well, nobody could have anticipated that,’ but the practical matter is that if you’re doing good deep scenario forecasting, you can actually work through these problems and get answers and insights pretty quickly. If all you are doing is looking at the data today, which essentially tells you what was going on a few weeks ago, and you don’t even look ahead the next couple of weeks and you just decide to open, it’s a little bit of a blind opening.
Paul Minshull
[iii] An upcoming blog will outline specifics on our interactions with a wide range of governments and health regions since March 2020 reinforcing our desire to help
[iv] September 3, 2020 — https://www.kitchenertoday.com/local-news/ontario-based-company-creates-pandemic-forecasting-system-2687481
It has been incredibly difficult to get the government to actually even take a look at what we’ve done — which to be honest, has been a very big shock to us. So to be honest at this stage, we’ve pivoted more to the private sector and away from public health, simply because they seem to be too reactive to look at how it can help them
Paul Minshull
[v] July 21, 2020 – Markham company develops forecasting model to manage second wave of COVID-19 — https://www.yorkregion.com/news-story/10079382-markham-company-develops-forecasting-model-to-manage-second-wave-of-covid-19/
With the type of sophisticated modelling Scarsin provides — which can be honed down to specific regions and guide where the best allocation of funds and resources could go — Minshull is “perplexed” why the company hasn’t had much luck at sitting down at the table with the province. The company has sent numerous emails to Premier Doug Ford since May, and has offered business cases and proposals to various agencies.
I feel like we have so much to offer and help in this process. We’re at a million dollars of investment, thousands of hours into building this platform, and we want to help, but virtually none of them have taken any action whatsoever. I think at least taking a look at it would be smart and prudent, even if it is nothing more than benchmarking.
Paul Minshull
[vi] August 12, 2020 — https://www.itbusiness.ca/news/canadian-governments-are-dragging-their-feet-in-deploying-forecasting-solutions-says-software-firm-ceo/115903
Schools are a game changer,” he said. “You’re opening up tens of millions of daily contacts, because every child and every person has seven to 15 kind of infectious potential contacts in a day. So, you’re just turning on this massive contact machine that hasn’t been here.
Paul Minshull
The mathematical probability is there’s absolutely going to be wave two,” he said. “The question is, which regions, how soon, and how big, and does it become big enough to overwhelm the tracking and tracing?
Paul Minshull
[viii] July 21, 2020 – Markham company develops forecasting model to manage second wave of COVID-19 — https://www.yorkregion.com/news-story/10079382-markham-company-develops-forecasting-model-to-manage-second-wave-of-covid-19/
Everyone is trying to do their own thing to solve the same thing. The platform we’ve built over the past 15 years, we believe, can build a solution for Ontario and Canada and we’d like to see it used by lots of different stakeholders. This is an integrated crisis and it needs an integrated solution.
Paul Minshull
![scarsin logo black] Scarsin COVID 19](https://scarsin-covid.com/wp-content/uploads/2020/03/scarsin-logo-black.png)
Trackbacks & Pingbacks
[…] Oct. 2, in a blog post called “Wave 2 will be late, long and local in Ontario,” the company forecasted that Ontario would have a minimum of 1,540 new cases per day by […]
[…] Oct. 2, in a weblog put up known as “Wave 2 will be late, long and local in Ontario,” the corporate forecasted that Ontario would have a minimal of 1,540 new circumstances per […]
[…] Oct. 2, in a blog post called “Wave 2 will be late, long and local in Ontario,” the company forecasted that Ontario would have a minimum of 1,540 new cases per day by […]
[…] Oct. 2, in a weblog submit known as “Wave 2 will be late, long and local in Ontario,” the corporate forecasted that Ontario would have a minimal of 1,540 new instances per day […]
[…] October 2, in a blog post called “Wave 2 will be late, long and local in Ontario,” the company forecasted that Ontario would have a minimum of 1,540 new cases per day by […]
[…] Oct. 2, in a blog post called “Wave 2 will be late, long and local in Ontario,” the company forecasted that Ontario would have a minimum of 1,540 new cases per day by […]
[…] October 2, in a blog post called “Wave 2 will be late, long and local in Ontario,” the company forecasted that Ontario would have a minimum of 1,540 new cases per day by […]
[…] October 2, in a blog post called “Wave 2 will be late, long and local in Ontario,” the company forecasted that Ontario would have a minimum of 1,540 new cases per day by […]
Comments are closed.